
Data-driven Human Resources

Things get done by people, human resource (HR) is a crucial component of successful companies, business sectors, and the economy at large. A much narrower concept that is similar to HR is human capital which refers to the value (knowledge) of an individual concerning the economic growth.
In the current day workplace, employees are viewed as assets for the organisation, as long as they continue to increase in value for the employer; increase value comes through training and self-development. When employees quit (attrition) they become a liability for their employer.
Employee turnover is a natural part of business in most industries. The Society of Human Resource Managers (Kantor, 2017) estimates that replacing an employee with relevant experience cost six to nine months salary on average. This is money that was invested in training the employee during their stay at the organisation.
Moreover, excessive turnover of employees decreases the overall efficiency of the organisation.
Replacing an employee cost the company in other ways, e.g., advertising for the vacancy, recruiting candidates and interviews are time-demanding tasks. In most cases, before the organisation finds a new candidate, a supervisor or other employees will have to cover until the position of the employee who left is filled. This breaks the dynamics of the team and might reflect on the companies reputation and integrity.
Preventing attrition (employee churn) is an integral part of the HR management which has been neglected in the past. Current attempts to prevent attrition is based on the experience of HR managers which is often suboptimal especially in large firms. Adopting a data-driven approach to HR management is a hot topic and has been receiving continuous attention lately.
What this article is about
This article looks at a synthetic dataset from a manufacturing company whose HR management intends to answer three essential questions:
- What are the factors affecting attrition (employee churn)
- Can employee attrition be predicted months before they quit?
- How long will an employee work for an organisation before quitting?
All three questions are relevant in their own right. Factors affecting attrition if known will give the HR management insights on making adjustments. The aim remains to prevent employees with a high probability of attrition from leaving. However, not all employee attrition is detrimental for the organisation. Some employees quitting the organisation at a certain time point might tend out to be beneficial for the organisation. On the other hand, the same employee resigning at a different time point might be detrimental. Therefore, the time to attrition is a very relevant problem to solve.
This article focuses on the first two problems 1. and 2. The third problem will follow in the next blog post.
Nature of the data

We split employees’ characteristics/ variables into 5 broad groups.
Personal
Gender, Age, marital status, education, total working years, number of companies worked for, etc.
Job related
Job level, job role, department, monthly income, training times last year, performance rating, job involvement, etc.
Career at the company
Years at the company, years in the current role, years since last promotion, years with the current manager etc.
Satisfaction
Relationship satisifaction, environmental satisfaction, job satisfaction
Work intensity
Work-life balance, business travel, overtime, distance from home.
The model
All these factors as of now have been speculated by the HR management as potential predictors of attrition. We also know the attrition status of all employees. The prediction model we will develop makes use of the current knowledge of attrition for future predictions.
Our approach here is using the different variables/employee characteristics to create an attrition score; the attrition score is the weighted average of the variables. We use a simple formula of the form
\[\text{attrition score}= \text{variable}_1\times \text{weight}_1+\text{variable}_2\times \text{weight}_2+\ldots\]The attrition score can then be converted into a probability of attrition in a straight forward way.
The variable weights determine how much influence a variable has on the attrition score. Variables with large weights influence the attrition score more. Some variables end up with a zero weight and contribute nothing to the attrition score.
The weights also have signs; the signs add more flavour to the interpretation. Variables with a positive weight translate into a high probability of attrition if an employee has a large value for that variable. On the other hand, variables with a negative weight translate into a small probability of attrition if an employee will have a large value for that variable. The nice figure below shows the specific results obtained from the synthetic dataset.
What we found
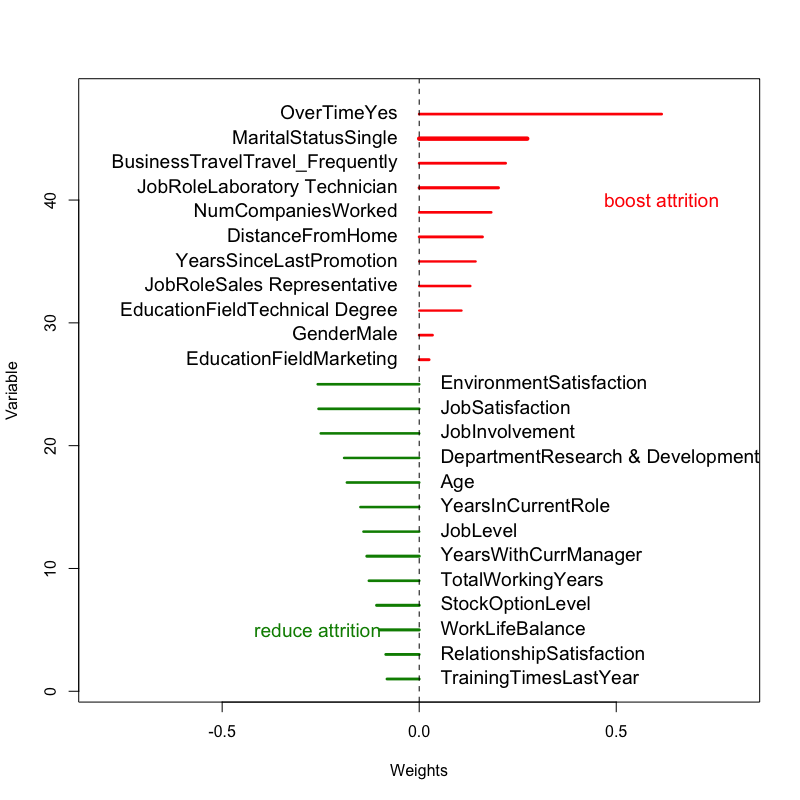
The figure above answers the first question the HR management of the manufacturing company was asking; namely “What are the factors affecting attrition?”
The figure shows the variables against their weights with positive weights corresponding to variables that boost attrition and negative weights corresponding to variables that reduce attrition. Amongst the variables that boost attrition, overTime stands out. An employee who works overtime is more likely to quit compared to an employee with similar characteristics with no overtime. Of course, this will depend on whether the employee is willingly working overtime and receives extra compensation for it.
The results also show that employees with single marital status will easily leave the company compared to their married colleagues with similar characteristics. This makes sense because single people typically have no kids, are younger, most likely to have less financial commitments and will often quit their jobs impulsively unlike their married colleagues, who perhaps might want to first consult with their spouse, take the children into account and so on.
This dataset suggests that employees who travel frequently are also more likely to quit their job. Well, this is different for me though, I typically prefer to travel, but I guess most people in this company don’t, and it drives them to quit.
On the other hand, when employees are satisfied with their working environment, they tend to stay working for their employer. Of course, this makes sense, spending on average eight hours a day, five days a week in a place you don’t like can be difficult. Job satisfaction and how involved employees are at their job also makes employees stay with their employer. The problem with these variables is the difficulty involved in measuring them. How do you measure environmental satisfaction and job satisfaction? Probably through questionnaires. Questionnaires have problems: employees who eventually answer these questionnaires might be dishonest, response bias, and so on. I will typically not trust these variables except there is an objective way to measure them.
Age – older people tend to stay with their employer. Age is also inversely correlated with marital status which positively drives attrition. Note that many variables are correlated in this data set but our algorithm has also taken their correlation into account.
The results also show that employees in R&D (research and development) tend to stay with their employer. Research involves constant innovation, and I will imagine that employees in this department like their job and tend to stick with their employer.
I have only mentioned the rationale behind a few variables from the plot. You can go through the graph to interpret the other variables similarly.
Predict attrition
Can we predict attrition? This was the second question the HR management department had particular interest in. The algorithm we developed for this dataset had an 85 percent accuracy in predicting attrition. These are impressive results. In general, the results make sense, and we hope this basic exercise has inspired you to transform your HR management to become data-driven.